Introduction to Bioelectricity Full
"Level Advance"
Introduction to Bioelectricity
It can be said that the use of electricity by biological systems as a signal between the nerves and muscles was first discovered in 1789 in a frog leg when the Italian physicist Luigi Galvani touched an exposed sciatic nerve with a charged metal scalpel and observed the dead frog’s leg flex as if it were alive. This finding provided the basis for the current understanding that electrical energy is the impetus behind muscle movement and also the driving force in other systems. This work was reported in the Proceedings of the Bologna Academy in 1791. At that time, Galvani believed that the muscular contractions were due to electrical energy emanating from the animal. However, Allesandro Volta was convinced that the electricity in Galvani’s experiments originated from the presence of dissimilar metals. Both of these interpretations represent the two different aspects of electrical potential in a biological system, the action potential and the steady source of electrical potential.
Bioelectricity is the electrical phenomenon of life
processes. The basic unit of this phenomenon is a cell that is polarized by
certain processes using energy. Specialized classes of cells that have
electrically excitable membranes such as neurons or muscle cells have
additional capabilities of developing action potentials. Many biomedical
instruments such as electroencephalography, electrocardiography, or
electromyography measure the compounds of these action potentials from the brain,
heart, and muscle, respectively.
In this chapter, the basic biological mechanisms behind
bioelectricity and its applications will be introduced
Electrical Properties of the Human body
The electrical properties of the human body follow the laws
of nature. The main chemical components of our body are water, salts (or their
ions), and some organic chemicals such as proteins, lipids, and so on. These
components show different electrical characteristics, however, we can build a
circuit model using a combination of resistors, capacitors, and/or generators.
The main difference between this model and the actual human body is that
current flow is caused not by the movement of electrons but by of ions
dissolved in water.
The human body exhibits many levels of structural
complexity. It is composed of various organ systems which can be grouped into
functional units. These are the integumentary system, skeletal system, muscular
system, nervous system, endocrine system, cardiovascular system, respiratory
system, digestive system, urinary system, and reproductive system. An organ is
a structure composed of several tissue types, which perform specific
functions. Again, tissues consist of a group of similar cells that have a
common function. Cells are the smallest units of all living things. Thus, even
if different systems or organs perform different functions, they consist of the same
building blocks, the cell, and cement (the extracellular matrix).
This means that each organ shares common features including
electrical properties. Some variations exist in terms of the chemical
composition in the cytoplasm (intracellular compartment), the cell membrane, and
extracellular components depending on cell or tissue type. These variations,
however, have little effect on electrical properties. The main factor which
determines the electrical properties of the tissue is the distribution pattern
of ion channels on the cell membrane. The amount and composition of lipids can
also influence the electrical properties of the human body by acting as a capacitor
but the capacitance value is almost the same across the cell.
Cell Membrane
Cells are basic building blocks of living organisms. The
boundary of animal cells is a plasma membrane composed of the thin lipid bilayer
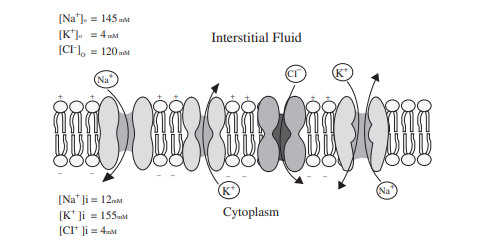
and proteins embedded in it (Fig. 2.1). The main role of the cell membrane is
to regulate the exchange of chemical substances. Both the lipid bi-layer and
some of the embedded proteins play critical roles in the electrical properties
of the cell using this exchange. The plasma (fluid in the inner space of cells) and
interstitial fluids (fluid in outer space) are composed of ions or electrolytes
of different species which are unequally distributed across the membrane. This
membrane prevents water molecules and ions from diffusing across it. The most
common electrolytes are Na+ (sodium), K+ (potassium), Cl− (chloride) and Ca++
(calcium). Other components such as H+ (hydrogen), HCO3 − (bicarbonate), NH4+
(ammonium), or phosphate ions contribute minimally to membrane potential.
Protein components endow the membrane with a selective permeability to some
ions. The driving force of this exchange is initially a difference in
concentration between the inside and outside of the cell. This difference or
concentration gradient is maintained mainly by Na+/K+ pumps that move Na+ out
of the cell and K+ into the cell using energy. Selective permeability is also
determined
Fig. 2.1 Structure of the plasma membrane. Membrane is
composed of a lipid bilayer with embedded proteins. The proteins shown in the
figure are ion channels and Na+/K+ pumps as illustrated, however there are
other proteins embedded in the membrane that act as receptors, transporters and
serve other functions by ion channels. Ions pass through channels that are
selective for that specific ion.
There are four major ion channels, Na+ channel, K+channel,
Cl− channel, and Ca++ channel. represents a plasma membrane with ion
channels and a Na+/K+ pump with typical ion concentrations of each side of the
membrane. The flow of ions in response to concentration gradients is limited by
the selectively permeable cell membrane and the resultant electrical field.
Membrane Potential
To understand membrane potential better consider an environment with only one ion species, for example, K+ is present in solution. If the solution is divided into two compartments by a membrane with K+ channels, and the concentration of K+ is higher in one compartment, then there will be a net flux from the compartment with a higher concentration to the lower one (extracellular interstitial fluid). For this situation, the flux due to concentration gradient (diffusion) tends to push K+ to a compartment with low concentration (outside of the cell) and is given by
JK (diffusion) = −Dd[K+]/dx
from Fick’s law where D is the diffusivity constant. The flux of K+ will lead to a positive charge accumulation outside of the cell. The flux due to the electrical field (drift) tends to push K+ inside the cell and is given by
JK (drift) = −μZ[K+]dv/dt
from Ohm’s law where μ is mobility in m2/sV, Z is ionic valence and v is the voltage across the membrane.
Thus, the net flow is
JK = JK (diffusion) + JK (drift) = −Dd[K+]/dxJK − μZ[K+]dv/dt
Using the Einstein relation, D = KTμ/q, the total flow is given by
JK = −RT/qμd[K+]/dx − μZ[K+]dv/dt
where R is Boltzmann’s constant, T is the absolute temperature in degrees Kelvin, and q is the magnitude of the electric charge.
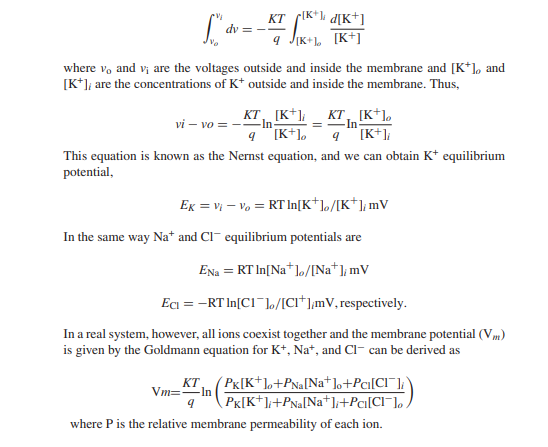
At equilibrium when the flow of K+ into the cell is balanced by the flow out of the cell thus
RT/qμd[K+]/dx − μZ[K+]dv/dt = 0
Integrating this equation from outside the cell to inside
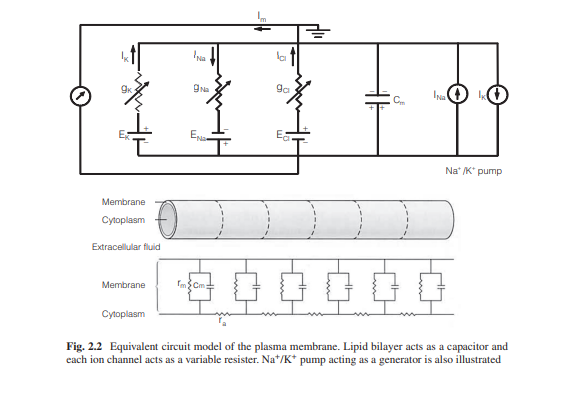
Equivalent Circuit Model for the Plasma Membrane
Developing an equivalent circuit model of the cell
membrane is helpful for understanding membrane potential. The membrane is a
lipid bilayer that is embedded with different types of ion channels. Ion
channels act as a resister however, since they are characterized as being open
or closed, thus they are variable resisters. Equilibrium potential for each ion
is the electrical potential difference across the channel and is modeled as
batteries.
There is a steady outflow of K+ ions and an inflow of Na+
ions, thus when left alone, this would drive the membrane potential toward 0.
To prevent this, Na+/K+ pumps are used in equal and opposite directions to
these passive currents and can be modeled as generators.
The cytoplasm and interstitial fluid are the electrical
conductors and they are separated by the lipid bilayer of the membrane which has
an insulating property.
This feature can be modeled as a capacitor. Capacitance for a
cell membrane is approximately 1 μF/cm2.
By combining the above ion channels as resistors, Na+/K+
pumps as a generator, and lipid bilayer as capacitors, one can develop an
integrated model of the cell membrane as shown in Fig. 2.2.
Graded Response of Membrane Potential
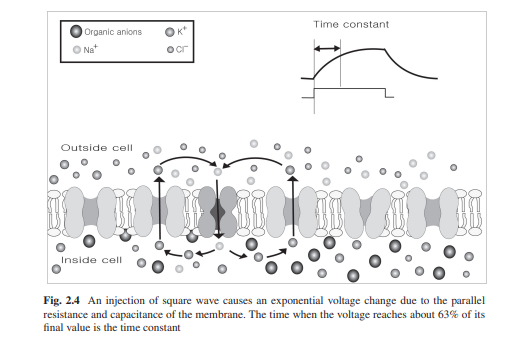
Changes in the open probability of sets of ion channels cause membrane potential change in limited areas. The change can depolarize or hyperpolarize the membrane potential. For example, either a decrease of K+ permeability or an increase of Na+ permeability will cause the membrane potential to move closer to the sodium equilibrium potential (depolarization). Opening either sodium channels or nonselective cation channels will lead to inward movement of Na+ thus causing depolarization by moving the membrane potential toward some value roughly midway between the sodium equilibrium potential and the potassium equilibrium potential. This graded potential spreads along the membrane by changing the charge on the membrane capacitance and by flowing through open channels which are equivalent to a resistor. This structure is equivalent to an RC circuit and in this case, a step-change in current flow causes an exponential change in membrane potential. The time it takes for the membrane potential to reach about 63% (1 − 1/e) of its final value is the time constant (τ) of the membrane. The time constant can be calculated by multiplying the resistance and the capacitance of the membrane (Fig. 2.3).
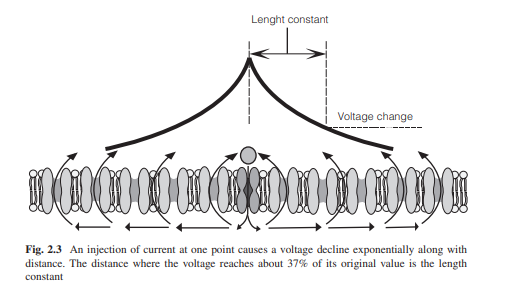
As the current flows along the membrane, some of the current
leaks through open channels in the neighboring areas. As a result the membrane
potential progressively decreases with increasing distance from a current
source. This spatial pattern is exponential and the distance where the voltage
change to 37% (1/e) of its original value is the length constant (λ) (Fig.
2.4).
(Fig. 2.4)
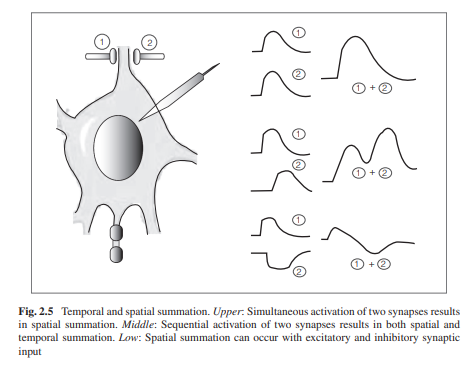
These grade responses can interact with each other and can
be spatially or temporally summated. Two successive grade responses will add to
each other with a degree of temporal summation. Two stimuli at neighboring
sites also add to each other with a degree of spatial summation (Fig. 2.5).
Action Potential
As most neurons or muscle cells are much longer than their
length constants, the grade responses disappear when flowing along with the cell,
thus the responses cannot deliver signals from one end to the other in the cell.
Excitable cells are distinguished by their ability to generate action
potentials that can propagate without losing their amplitude.
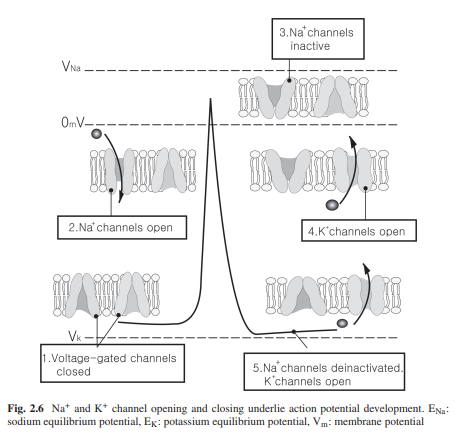
The core structures for generating action potential are
voltage-gated ion channels, mainly voltage-gated Na+ and K+ channels. Depolarization
by synaptic input or by receptor potential causes the opening of both channels;
however, Na+ channels open faster and are responsible for the rising phase of the action potential. Since they are voltage-gated, the opening of the Na+ channel will
depolarize the membrane potential which will then cause more Na+ channels to
open. The membrane then becomes overwhelmingly permeable to Na+ causing the
membrane potential to approach Na+ equilibrium potential. This phenomenon can
be calculated using the Goldmann’s equation described before. Once open,
however, the Na+ channels spontaneously close by the inactivation gate and they cannot
open again until the membrane potential returns to resting membrane potential. The closing of Na+ channels causes the membrane potential to return to its resting level.
In addition, K+ channel start to open slowly and this facilitates the falling phase.
The permeability of K+ in this stage dominates and the membrane potential first
approaches resting membrane potential then approaches K+ equilibrium potential
(after hyperpolarization) (Fig. 2.6).
The all-or-none feature of action potential implies that
stimulus less than a certain level (threshold) of depolarization results in a
graded response that would not be transferred. However, a stimulus big enough
to move the membrane potential beyond the threshold will generate action a
potential that can propagate to distant regions of the cell. In neurons, the
axon hillock (initial point of axon) has the lowest threshold with relatively
high densities of Na+ channels and is thought to be the principal trigger zone.
The graded responses produced throughout the dendrites or cell body is summed
spatially and temporally, and if the summed response is large enough to pass
the threshold, an action potential will be generated at the axon hillock. At this point, the amount of response determines the frequency of action potential. Thus the function
of the axon hillock is similar to that of an analog-digital converter.
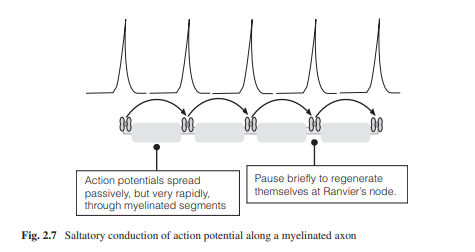
After generating an axon potential at the trigger zone, it begins to propagate to neighboring segments of the membrane and depolarize them to threshold triggering action potentials in the next neighboring area and so on. This propagation is unidirectional, from axon hillock to axon terminal because, in the case of the neuron, the proximal segment just traversed by the action potential enters a refractory period and thus becomes inexcitable. The velocity is a function of the length constant, that is, the longer the length constant the further an action potential can travel down the axon segment before it decreases to subthreshold levels. To deliver the action potential faster, invertebrates have thick axon fibers, up to hundreds of micrometers in width, to increase the length constant. Vertebrates on the other hand have myelinated axons which allow rapid conduction with thin axons. Myelin acts as an insulating sheath, allowing an action potential to spread along the axon until it gets to a node of Ranvier, which is a bare portion of the axon without myelin. As a result, action potentials jump from one node to the next, and so on. This conduction is called saltatory conduction. Saltatory conduction not only functions as a method of fast conduction of action potentials, but it also has the function of verifying information by ensuring that the frequency of action potential is correct (Fig. 2.7).
Synaptic Transmission
Equivalent Circuit Model of Tissues and Organs
Biomedical Devices
Electrocardiography
Electroencephalography
Electromyography
Current Research Trends in Biomedical Electrical Instruments
References
1. Enderle J (2004) Bioelectric phenomenon. In: Introduction
to biomedical engineering, 2nd edn.
Elsevier, Oxford, UK, pp 627–692
2. Grimnes S, Martinsen OG (2008) Bioimpedance and
bioelectricity basics, 2nd edn. Academic
Press, Oxford, UK
3. Hille B (2001) Ion channels of excitable membranes, 3rd
edn. Sinauer Associates,
Sunderland, MA
4. Aidley DJ (1998) The physiology of excitable cells.
Cambridge University Press,
Cambridge, UK
5. Delmar M (2006) Bioelectricity. Heart Rhythm 3:114–119
6. Zhu F, Leonard EF, Levin NW (2005) Body composition
modeling in the calf using an
equivalent circuit model of multi-frequency bioimpedance
analysis. Physiol Meas 26:S133–43
7. Geddes LA (1972) Electrodes and the measurement of
bioelectric events. Wiley-Interscience,
New York, NY
8. Reilly JP (1998) Applied bioelectricity. From electrical
stimulation to electropathology.
Springer, New York, NY

Comments
Post a Comment